genieclust.plots
Various plotting functions
- genieclust.plots.plot_scatter(X, y=None, labels=None, axis=None, title=None, xlabel=None, ylabel=None, xlim=None, ylim=None, **kwargs)
Draws a scatter plot
- Parameters:
- Xarray_like
Either a two-column matrix that gives the x and y coordinates of the points or a vector of length n. In the latter case, y must be a vector of length n as well.
- yNone or array_like
The y coordinates of the n points in the case where X is a vector.
- labelsNone or array_like
A vector of n integer labels that correspond to each point in X, that gives its plot style.
- axis, title, xlabel, ylabel, xlim, ylimNone or object
If not None, values passed to matplotlib.pyplot.axis, matplotlib.pyplot.title, etc.
- **kwargsCollection properties
Further arguments to matplotlib.pyplot.scatter.
Notes
If X is a two-column matrix, then
plot_scatter(X)is equivalent toplot_scatter(X[:,0], X[:,1]).Unlike in matplotlib.pyplot.scatter, for any fixed
j, all pointsX[i,:]such thatlabels[i] == jare always drawn in the same way, no matter themax(labels). In particular, labels 0, 1, 2, and 3 correspond to black, red, green, and blue, respectively.This function was inspired by the
plot()function from the R packagegraphics.Examples
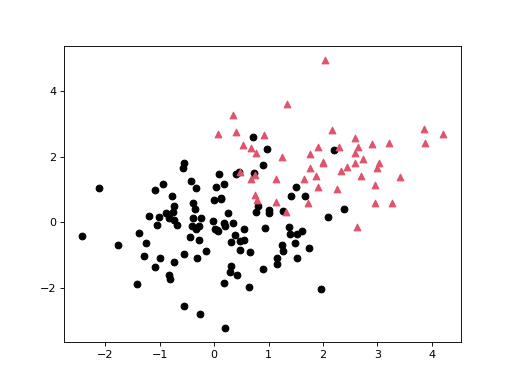
An example scatter plots where each point is assigned one of two distinct labels:
>>> n = np.r_[100, 50]
>>> X = np.r_[np.random.randn(n[0], 2), np.random.randn(n[1], 2)+2.0]
>>> l = np.repeat([0, 1], n)
>>> genieclust.plots.plot_scatter(X, labels=l)
>>> plt.show()
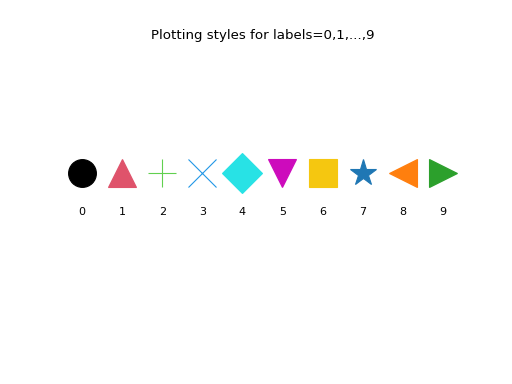
Here are the first 10 plotting styles:
>>> ncol = len(genieclust.plots.col)
>>> nmrk = len(genieclust.plots.mrk)
>>> mrk_recycled = np.tile(
...     genieclust.plots.mrk,
...     int(np.ceil(ncol/nmrk)))[:ncol]
>>> for i in range(10):
...     plt.text(
...         i, 0, i, horizontalalignment="center")
...     plt.plot(
...         i, 1, marker=mrk_recycled[i],
...         color=genieclust.plots.col[i],
...         markersize=25)
>>> plt.title("Plotting styles for labels=0,1,...,9")
>>> plt.ylim(-3,4)
>>> plt.axis("off")
>>> plt.show()

- genieclust.plots.plot_segments(pairs, X, y=None, style='k-', **kwargs)
Draws a set of disjoint line segments
- Parameters:
- pairsarray_like
A two-column matrix that gives the pairs of indices defining the line segments to draw.
- Xarray_like
Either a two-column matrix that gives the x and y coordinates of the points or a vector of length n. In the latter case, y must be a vector of length n as well.
- yNone or array_like
The y coordinates of the n points in the case where X is a vector.
- style:
See matplotlib.pyplot.plot.
- **kwargsCollection properties
Further arguments to matplotlib.pyplot.plot.
Notes
The function draws a set of disjoint line segments from
(X[pairs[i,0],0], X[pairs[i,0],1])to(X[pairs[i,1],0], X[pairs[i,1],1])for allifrom0topairs.shape[0]-1.matplotlib.pyplot.plot is called only once. Therefore, you can expect it to be pretty pretty fast.
Examples
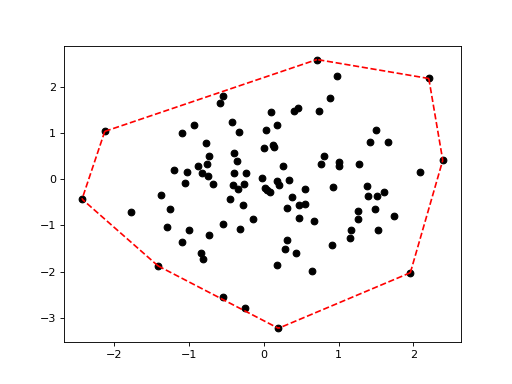
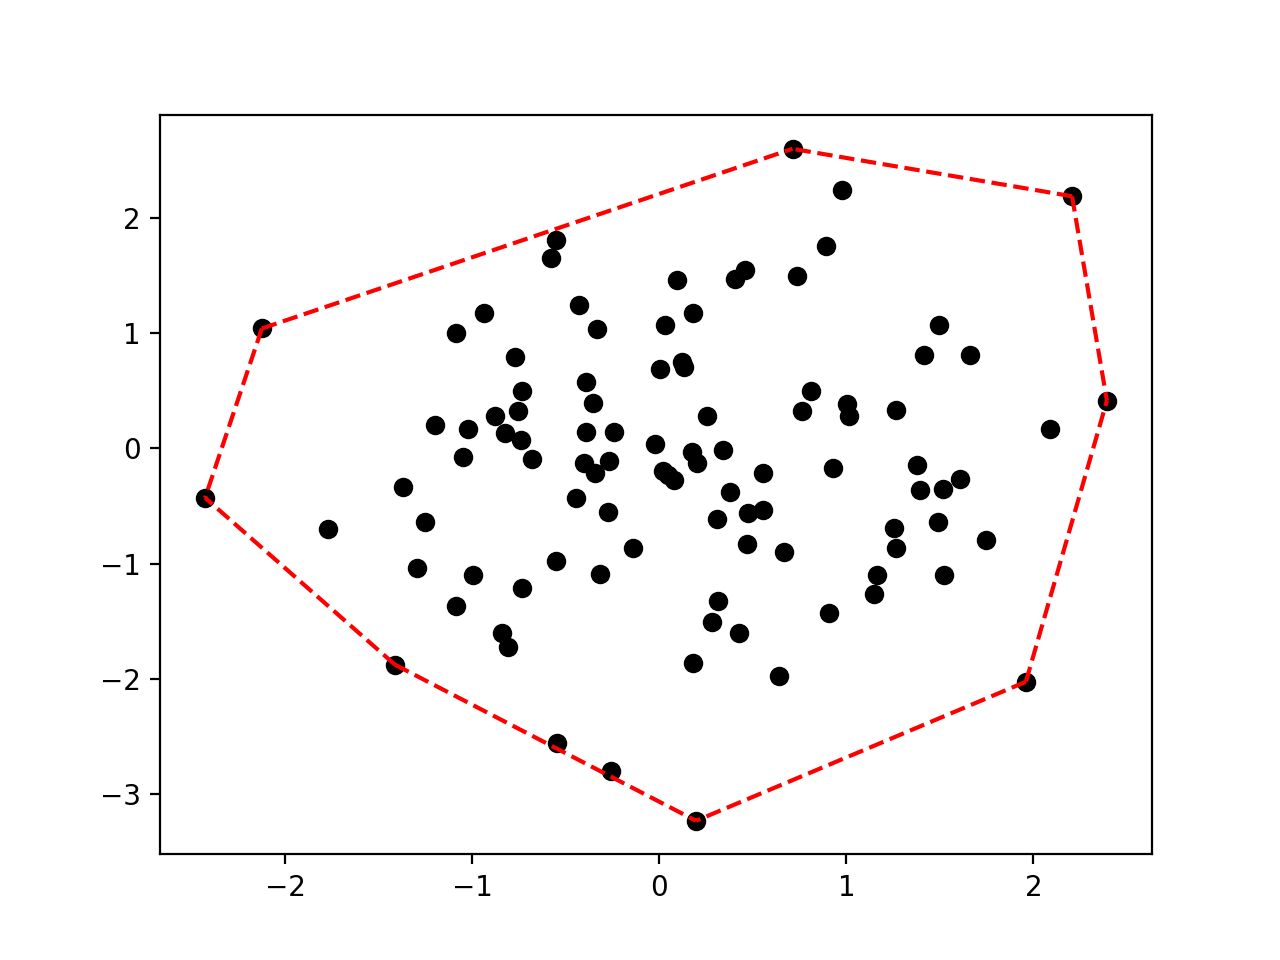
Plotting the convex hull of a point set:
>>> import scipy.spatial
>>> X = np.random.randn(100, 2)
>>> hull = scipy.spatial.ConvexHull(X)
>>> genieclust.plots.plot_scatter(X)
>>> genieclust.plots.plot_segments(hull.simplices, X, style="r--")
>>> plt.show()

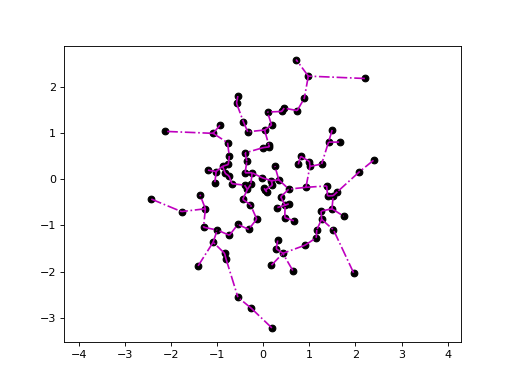
Plotting the minimum spanning tree:
>>> X = np.random.randn(100, 2)
>>> mst = genieclust.internal.mst_from_distance(X, "euclidean")
>>> genieclust.plots.plot_scatter(X)
>>> genieclust.plots.plot_segments(mst[1], X, style="m-.")
>>> plt.axis("equal")
>>> plt.show()
